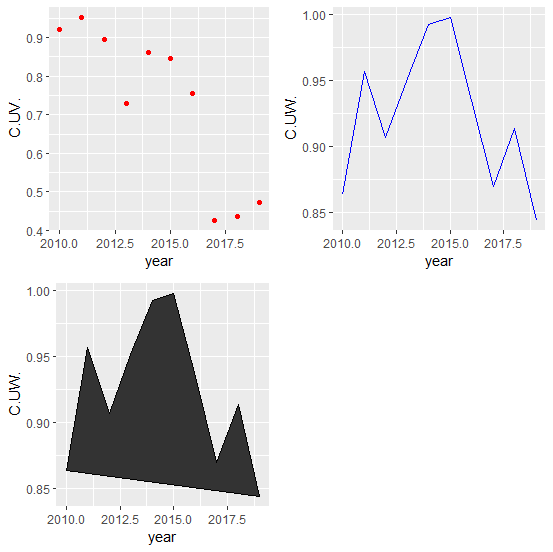
用R画图
不同类型格式图形合并到一个图形
需要使用ggpubr包的ggarrange功能
library(ggplot2)
library(ggpubr)
data1=read.csv("d:\\2.csv")
p1=ggplot(data1)+geom_point(aes(year,C.UV.),colour="red")
p2=ggplot(data1)+geom_point(aes(year,C.UW.),colour="blue")
p3=ggplot(data1)+geom_point(aes(year,C.UZ.),colour="black")
ggarrange(p1, p2, p3, ncol = 2, nrow = 2)
特点:可以合并的图形不受限,颜色等可以自由设置。

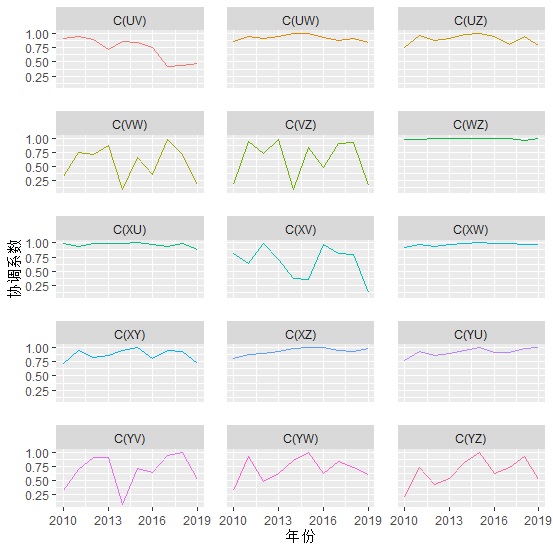
ggplot分面图
library(ggplot2)
data1=read.csv("d:\\1.csv")
ggplot(data1,aes(年份,协调系数)) +
geom_line(aes(colour=ser)) +
facet_wr数据ap(~ser,ncol=3) +
scale_x_continuous(breaks=seq(2010,2019,3)) +
theme(axis.text.x=element_text(),legend.position="none",panel.spacing = unit(1.2, "lines"))
特点:分面图格式,要求同一套数据下根据指标进行分组。图表类型都是统一的。


